
In today’s article, I’ll share my experience developing a centralized logging system for monitoring 300 web applications in real-time.
Background
I was working for a company that maintained roughly 300 web applications spread across 6 web servers. These applications were a mix of internal tools and customer-facing services. Our development team was relatively small, consisting of three full-time developers, a project manager, and an occasional consulting developer.
With so many applications and a lean team, we needed to get ahead of bug reports. The typical scenario was frustratingly predictable: users would encounter a bug, work around it silently, and only report it when it became critical – usually marked as urgent 🚨
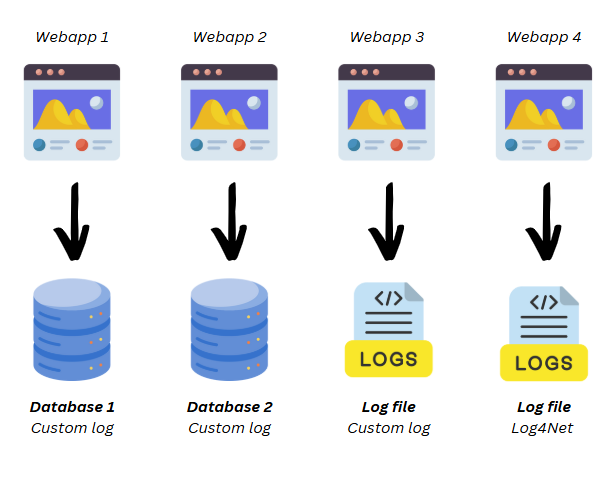
Additionally, we lacked standardization in our logging practices. Some applications wrote logs directly to the file system (either through custom implementations or libraries like Log4Net), while others stored them in application-specific database tables. Though similar, these logging tables weren’t consistent across applications.
The challenge
We faced two main challenges:
- Establishing a standardized logging framework
- Creating a unified monitoring system for all logs
Developing a Standard Logging Library
My first step was to standardize our application logging by creating a custom library. I developed it in .NET Standard to support both our .NET Framework and .NET Core applications.
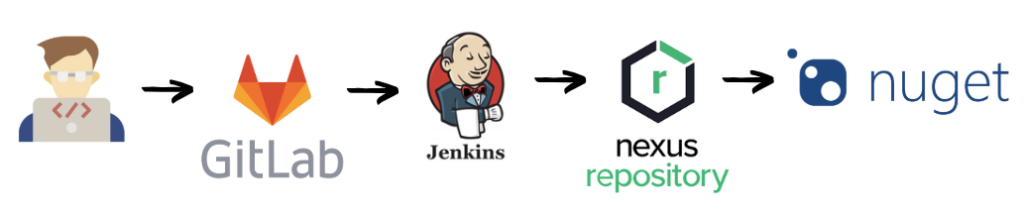
The library was automatically distributed through Jenkins to our Nexus Sonatype repository (a Nuget repository I had set up earlier to improve library management). This made it easy to install the logging library across projects and manage updates efficiently.
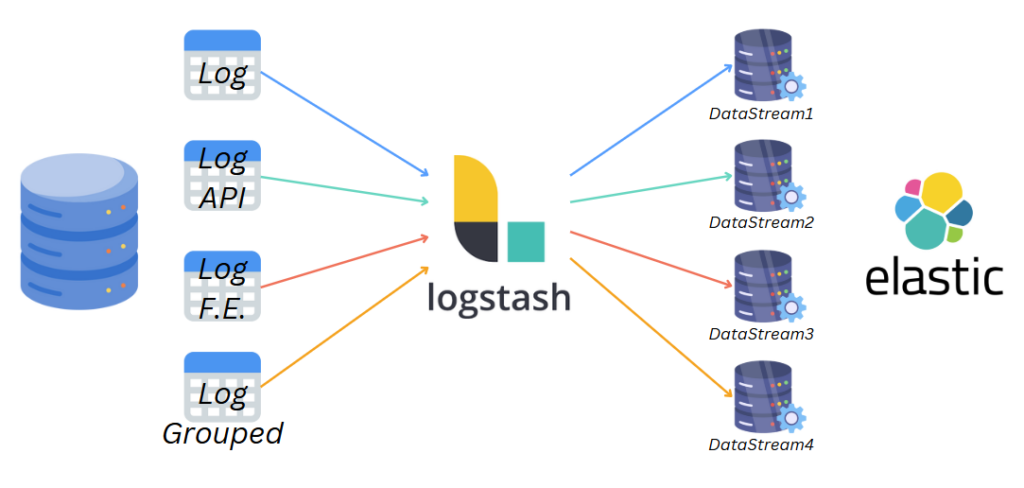
The library included an internal migration mechanism and created four standardized logging tables in each application’s database (with file system fallback):
- A general-purpose logging table
- An API call tracking table (for both internal and external APIs)
- A frontend-specific logging table
- An analytics table for grouped logs and metrics
We began implementing this new library in all new projects and gradually replaced legacy logging methods in existing ones. Within a few months, we had standardized logging across approximately 50 databases.
Implementing ELK (Elasticsearch – Kibana – Logstash)
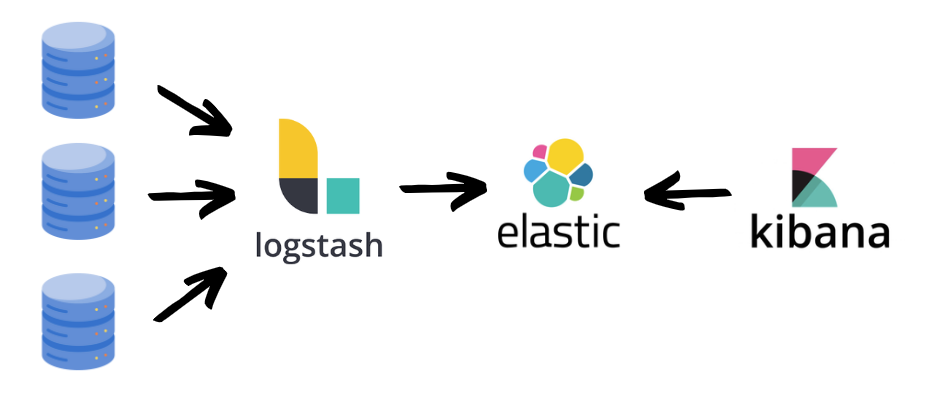
For log centralization and monitoring, I chose the ELK stack: Elasticsearch for storage, Kibana for visualization, and Logstash for log collection.
This open-source stack (with optional paid features for advanced functionality) proved more than sufficient for our needs.
The workflow is straightforward: Logstash collects logs from various databases, stores them in Elasticsearch, and Kibana provides customizable visualization dashboards.
While Logstash is typically used to standardize logs from different formats, we could skip this feature since our custom logging library already handled standardization.
Setting up ELK
I began by installing the ELK stack on a company server following the official documentation. After generating the necessary HTTPS certificates for secure communication between components, I configured four distinct datastreams – one for each type of log table, regardless of the source database.
Configurazione Logstash and automating Pipeline Management
Logstash processes data through configured pipelines.
ISSUE
Rather than manually creating pipelines for each new database, I developed a Windows service to automate the process.
This Windows service:
- Scans all four database servers for tables using our standard logging schema
- Maintains a central registry of logging-enabled databases, automatically activating new ones and deactivating archived ones
- Automatically generates pipelines for new databases
- Removes pipelines for archived or deleted databases
To maintain control, new databases are registered in a management table where I could configure pipeline names, log tags, and activation status. This prevented test or temporary databases from being indexed unnecessarily.
Le pipeline erano generate in automatico a partire da un template e contenevano le query da eseguire sulle 4 tabelle di log, la destinazione dei dati in ELK, la frequenza di aggiornamento ed il campo identity da controllare per evitare di importare log doppi.
The service generates pipelines from a template, configuring the necessary queries for all four log tables, ELK destinations, update frequencies, and identity fields to prevent duplicate entries.
Building the Kibana dashboard
With automated pipeline management in place and Logstash feeding data to Elasticsearch, the final step was visualization through Kibana.
Beyond its role in stack management and datastream configuration, Kibana hosts our main monitoring dashboard, which includes:
- A real-time feed of API errors
- Applications generating the most errors (ERROR / EXCEPTION) within a configurable time window
- Application usage metrics (most and least used)
- A comprehensive error log viewer
Impact and results
What began as chaos has evolved into an organized, efficient system. As I write this, over a hundred applications are feeding logs into our ELK stack 🙂
The initial weeks revealed surprising insights – we discovered numerous errors in our most-used applications that users had simply learned to work around because reporting issues was too cumbersome😞
Was it worth the effort? Absolutely. We now catch errors before they become critical issues and have significantly improved user experience across many processes.
Our next step? Setting up an office monitor (or better yet, a TV) to display our dashboard for real-time monitoring!
Thanks for reading, and stay tuned for more articles!